18 October 2023 • 4 minute read
UK Insolvency Statistics Q2 2023: our analysis
Analysis and Commentary on the Insolvency Statistics Q2 2023
The quarterly insolvency statistics for April to June 2023 show that corporate insolvencies across the UK1 are at a 14-year high.
Increased insolvencies appear to be continuing with the monthly statistics for both August and September 2023, showing corporate insolvency numbers were higher than the same month last year. July’s figures showed a slight decrease year on year.
This article will analyse the figures in the Q2 statistics, examine the factors contributing to the current predicament and briefly consider the prognosis for the future.
Data
The Government currently publishes insolvency statistics both on a monthly and quarterly basis.2 This article predominantly focuses on the latest quarterly statistics for April-June published on 28 July 2023.
Part of the increase in the number of companies falling into difficulty reflects the higher number of companies overall. However, the number of company insolvencies in Q2 2023 was the highest since 2009, being 9% higher than in Q1 2023 and 13% higher than in Q2 2022. This reflects 1 in 192 active companies (at a rate of 52.0 per 10,000 active companies) entering insolvent liquidation between 1 April 2022 and 30 June 2023. This was an increase from the 43.9 per 10,000 active companies that entered liquidation in the 12 months ending 30 June 2022.
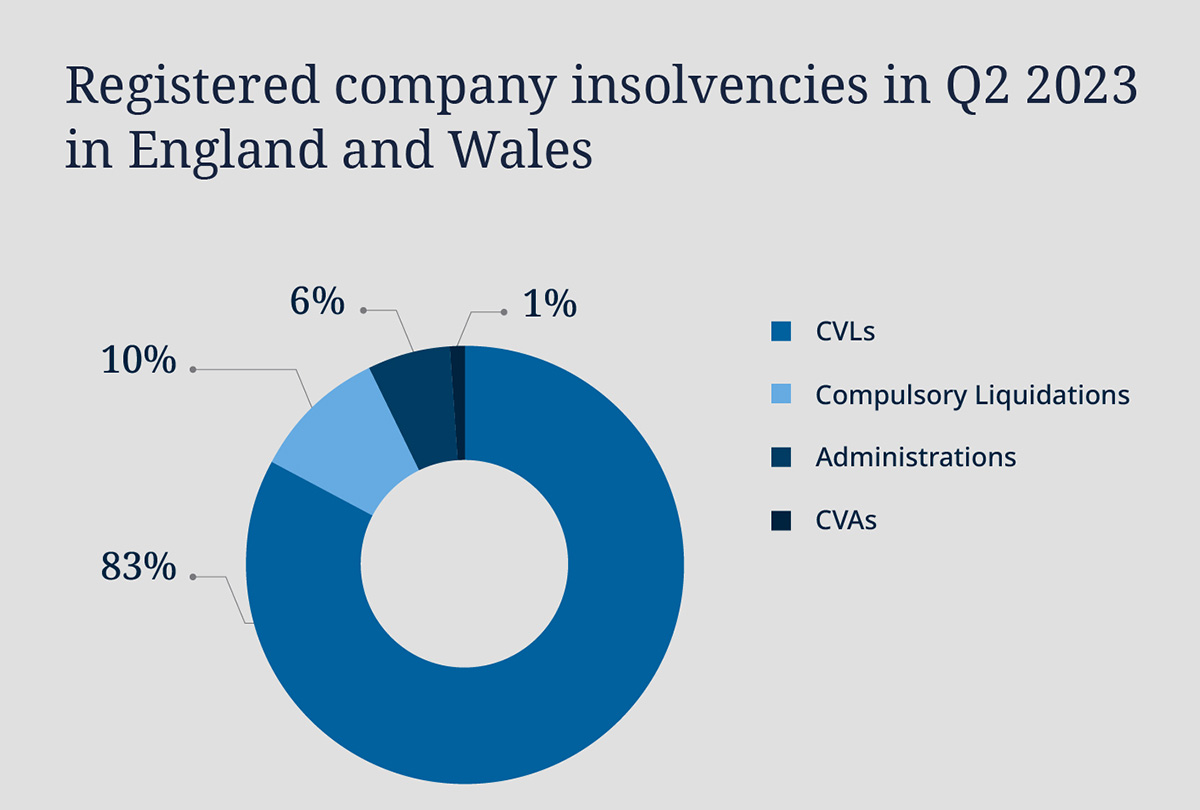
Specifically, there were 6,342 registered company insolvencies, comprising of:
- 5,240 creditors’ voluntary liquidations (CVLs);
- 637 compulsory liquidations;
- 409 administrations; and
- 56 company voluntary arrangements (CVAs).

Statistics show the five industries that experienced the highest number of insolvencies in the 12 months ending Q2 2023 were:
- construction (4,262);
- wholesale and retail trade; repair of motor vehicles and motorcycles (3,695);
- accommodation and food service activities (3,262);
- administrative and support service activities (2,222); and
- manufacturing (1,874).
Analysis and Themes
Experts agree that “recent statistics illustrate an unpredictable economic landscape, perhaps more so than a consistent downturn”. The reasons for companies collapsing are manifold: double-digit inflation; customers cutting back on spending; soaring energy prices coupled with rising interest rates and the end of the COVID-19 support schemes.
The BBC reports that geographical areas with a high number of independent firms saw the largest proportional rises in liquidations in 2022 compared to 2019.
The Government estimates that it has spent between GBP310 billion to GBP410 billion on COVID-19 related measures.3 This support was heavily relied on by multiple companies in order to stay afloat.
Furthermore, the temporary insolvency measures introduced pursuant to the Corporate Insolvency and Governance Act 2020 and the backlog of cases built up over the period when the courts were closed down meant that many insolvency cases were halted. Now that this is unwinding, the number of corporate insolvencies has steadily increased.
Additionally, after taking a more benign approach during the pandemic, HMRC is now said to enforce 40% of compulsory liquidations on a monthly basis.
Prognosis for the Future
Experts believe that corporate insolvencies are likely to remain high and increase further in the second half of 2023 and beyond. However, considering that events of the past two years have been unpredictable, perhaps, when future gazing, expect the unexpected.
1This article focuses on corporate insolvencies in England and Wales, for data on personal insolvencies and insolvencies in Northern Ireland and Scotland please see Company insolvency statistics - Q2 2023 | The Gazette and Commentary - Individual Insolvency Statistics April to June 2023 - GOV.UK (www.gov.uk).
2Note that following a consultation in 2023, the Insolvency Service will merge the monthly and quarterly statistics with the first release in the new format being published either in January or April 2024.
3Admittedly, this figure covers variety of measures, including support for the NHS and the Track and Track system. However, a substantial portion of these monies was designated for supporting businesses through loans, tax deferral and furlough schemes.